We help organizations make sense of the data they already have so teams can make clearer decisions, track progress, and report confidently to leadership, boards, and communities.
Common Scenarios We Support
Problems
Reporting & Analytics
Data lives in disconnected systems.
Finding & Sharing Information
Information is hard to find and share.
Tracking Work & Progress
Work is tracked in multiple tools.
Solutions
Connected Data
We bring information together from existing systems into consistent, usable views.
Purposeful Structure
Information is organized, so people can understand, track, and use it day to day.
Outcomes
Trusted Visibility
Teams can see what’s happening without piecing together data manually.
Shareable Reporting
Insights can be distributed confidently across teams and stakeholders.
How It’s Delivered
We connect reporting tools directly to existing systems.
Common sources include:
Spreadsheets and files
Databases
Operational and line-of-business systems
Field and project data platforms
Empowering Public Service Delivery with Data
When a territorial government department responsible for delivering essential social programs needed a more efficient way to manage applications, track approvals, and report on outcomes, Bizont delivered a tailored solution powered by Power BI. The platform streamlined operations and enhanced their ability to serve the community effectively.
The solution included:
Real-time status tracking to replace manual checklists
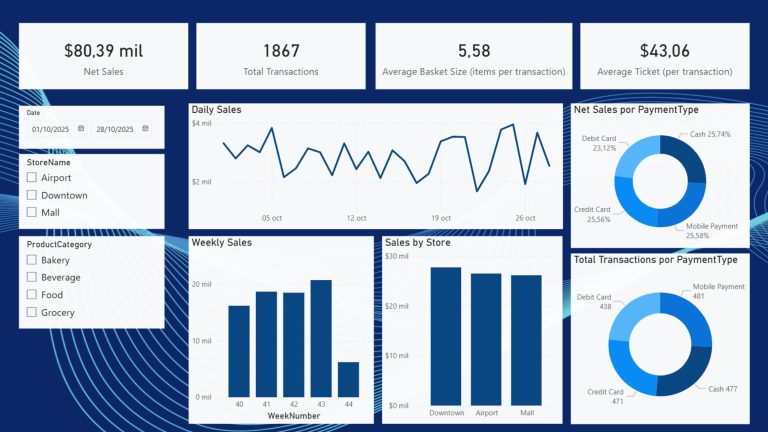
Interactive dashboards for data-driven insights
One-click data exports to streamline reporting
Key outcomes:
Faster processing speed
Improved data accuracy
Enhanced privacy compliance
Strengthened strategic decision-making
Modernizing a Government Employee Directory
A public-sector agency was relying on an outdated, difficult-to-navigate employee directory—making it hard for staff to find colleagues, understand reporting lines, or access information on mobile devices. Bizont designed and delivered a modern, mobile-responsive directory experience tailored to the agency’s internal workflows and security standards.
The solution included:
Search-first interface for fast access to people, roles, and departments
Real-time data syncing via secure integration with HR and identity APIs
Interactive org charts that visualize reporting structures and cross-functional teams
Responsive design that ensures seamless access across desktop, tablet, and mobile
Key outcomes:
Improved day-to-day collaboration across teams
Reduced search friction with intuitive navigation and live data
A scalable foundation for future HR tool integration
Full accessibility and usability across all devices