Using Power BI to Transform Multi-Department Reporting in the Yukon Government (YG)
Understanding the Challenge
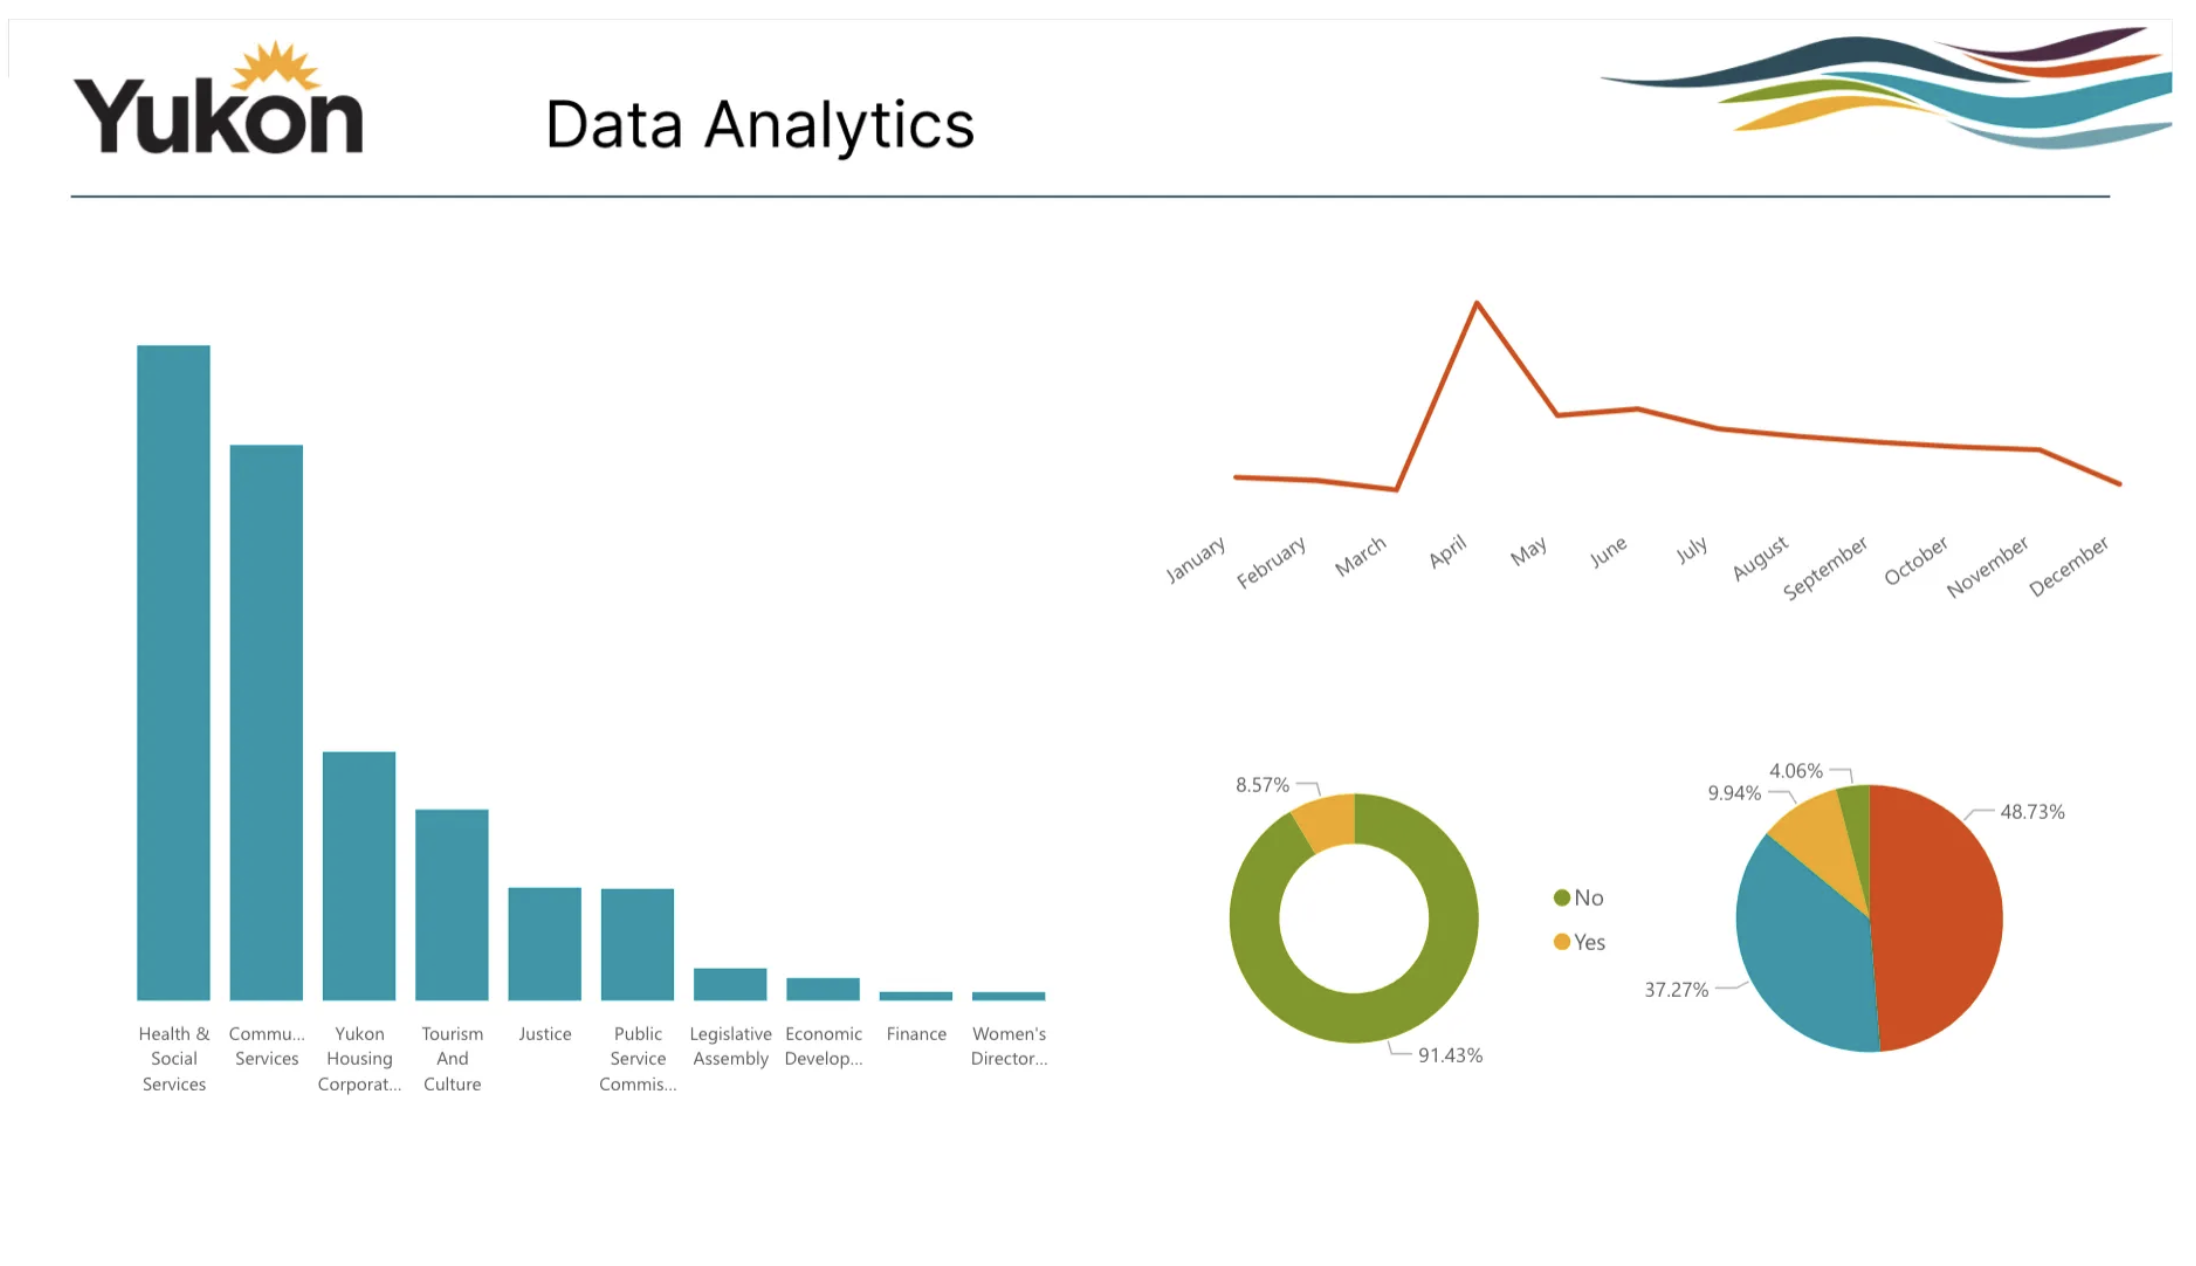
In early 2024, the Yukon Government (YG)’s Service Innovation and Support branch within the division of Information and Communications Technology (ICT) needed help turning their operational data into actionable insights. Each team used a platform called AMANDA to manage core workflows, but they lacked centralized, visual reporting. Bizont’s task: design custom Power BI dashboards for each department, despite working only with raw database access and limited stakeholder input.
What we discovered early on
🚨 AMANDA’s data schema was not designed for reporting. 📊 All departments shared a single data structure—adding complexity. 📑 Documentation was minimal, and test data was mixed with live production.
Instead of waiting for perfect clarity, we dove into the data and reverse-engineered the structure. From there, we could start building dashboards that revealed operational bottlenecks, key metrics, and lifecycle tracking.
Building with Flexibility in Mind
While specific insight needs varied within the branch, the structure of their reporting workflows was largely consistent.
What we delivered:
Dashboards prioritizing demographic data and tracking applicants across various programs.
Reports to monitor license types, durations, and compliance timelines.
Visuals to evaluate volume, status, and turnaround times of information requests.
We leveraged reusable components, templated models, and consistent data cleaning methods to streamline report development. This early standardization helped reduce the effort of expanding analytics to new departments in the future.
From Roadblock to Cloud Breakthrough
In early 2025, a new opportunity emerged: Granicus (AMANDA’s vendor) offered access to a SOAP-based API.
But we quickly ran into roadblocks.
Power BI Service (the cloud-based version) does not natively support SOAP APIs, especially those requiring dynamic authentication. Without a workaround, YG would need manual updates or on-premise gateways—making automation and scalability nearly impossible.
Our Solution: Build an intermediary RESTful API that:
Converts SOAP to REST for Power BI compatibility.
Enables cloud-native data refreshes—no gateways required.
Supports secure access, logging, and future integrations.
The move to a cloud-first data infrastructure not only improved performance and accessibility, but created a long-term reporting foundation that YG can expand across departments.
Lessons from the Frontlines
Working across departments with different reporting needs was a challenge, but it also evolved our approach.
Key lessons and wins:
🔍 Deep database exploration helped us stay productive, even when feedback was delayed. 📢 Bizont’s Project Manager’s proactive communication kept momentum high and departments engaged. 🛠️ We used each challenge to refine and standardize our approach so the next report took less time and delivered more value.
What Other Departments Can Learn
For other departments within YG, or governments across the North, we believe this project offers a blueprint:
It’s possible to extend the value of existing systems through API-driven integrations that unlock meaningful analytics and reporting.
Thoughtful planning today leads to scalable infrastructure tomorrow.
Early alignment on reporting requirements helps shape the right data foundation from the beginning—ensuring the structure supports both day-to-day insights and long-term needs.
When special reporting or KPIs are anticipated, designing the data infrastructure up front makes it easier to collect the right data and deliver meaningful, tailored visualizations.
Bizont can support modernization efforts with a combination of technical depth, project clarity, and a respectful, collaborative approach that is adapted to how government teams work.